2000 Field Summary
Portable Eddy Covariance Tower
Seward Peninsula, Quartz Creek
Variation of fluxes in CO2, H2O and energy over the different vegetation types
at Kougarok, Alaska using a portable eddy tower.
Hyojung Kwon
General Purpose
Multiple scales of spatial heterogeneity are characteristic of arctic tundra landscapes. Each region comprises a mosaic of distinct vegetation types occurring on scales of 100 m to 1 km, often controlled by soil, topography, and slope position as well as distinct microsite differences over centimeters to meters. Ecological studies have shown very different responses of Artic vegetation types to climate variability that appear sort out by functional types. Field experiments in Alaska that warmed air temperature resulted in the conversion of mesic tussock tundra to shrub tundra within 10 years, a trend also observed in unmanipulated control sites during a decade-long period of warmer surface temperature in the region. In this study, we used a portable eddy tower to compare fluxes in mass and energy exchanges from three different vegetation types within during the 2000 summer at Kougarok (Quartz Creek).
Study sites and Field measurement
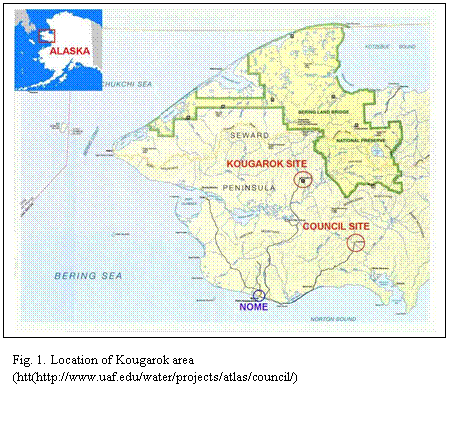
The Kougarok area presents an interesting array of landscapes for comparative analyses including well-developed tussock tundra, small patches of continuous shrubs and large uniform areas of moss/lichens. A portable eddy tower was set up at three different vegetation types including young tussock tundra, old tussock tundra and shrub tundra at the Kougarok, just north of Quartz Creek on the Seward Peninsula, AK during the 2000 growing season (July 25 – August 6) in (Table 1). Three sites were measured in the area corresponding to sites selected by Larry Hinzman et al. and Skip Walker et al., in which they have established long-term meteorological and hydrological stations. The mean canopy heights for the shrub tundra site and the old tussock tundra were approximately 1.3 m and 0.5 m, respectively. Below the canopy at the shrub site, there was almost a full cover of moss layer. The young tussock tundra burned in 1996 and site offered a good opportunity to examine the effects of tundra fires on surface energy, water and carbon exchange. The observation period at each site was limited to approximately 4 days and each site had > 200 m patch size in which the tower footprint encompassed.
Instrumentation
Measurement of mass (e.g. CO2 and H2O fluxes) and energy fluxes was made using tower-based eddy covariance techniques. Fluctuations in vertical, streamwise and lateral wind speed and temperature were measured at 10 Hz using a three-dimensional sonic anemometer/thermometer (model R3, Lymington, Hampshier) with a path length of 15 cm. CO2 and H2O vapor fluctuations were measured using an open-path infrared gas analyzer (IRGA) (model LI-7500, LI-COR, Inc., Lincoln, Nebraska). Sensor height was 2.8 m and the sensor separation between the sonic anemometer and the open-path was approximately 0.2 m.
Table 1. Study Sites at Kougarok, Alaska.
|
|
Young Tussock Tundra 1 |
Shrub Tundra |
Old Tussock Tundra |
|
Observation Period |
July 25 – 29 |
July 29 – August 2 |
August 2 – August 6 |
|
Location |
65o 26.40 N 164 o 34.73W |
65 o 27.29 N 164 o 37.77W |
65 o 25.76N 164 o 38.72 W |
|
Elevation |
885 feet |
725 feet |
291 feet |
|
Ecosystem Type |
Stiped |
Salix Veg. |
Typical tussock Tundra |
1 Young tussock tundra site was burned 1996.
Calibration of the open-path was executed using a standard gas (0 and 568 ppm) and a portable dew-point generator (model LI-610, LI-Cor, Inc., Lincoln, Nebraska). Net CO2, H2O vapor and sensible heat (H) fluxes were computed following coordinate rotation of the vertical, horizontal and streamwise axes. Fast response (10 Hz) fluxes were calculated and stored on a laptop computer as 30 minutes averages. Open-path flux estimates were corrected for the variation in air density due to simultaneous transfers of water vapor and sensible heat as the fluctuations in both CO2 and H2O vapor were measured in situ. Data were rejected when precipitation caused spikes in the sonic anemometer and open-path IRGA signals.
Meteorological measurements included net radiation (Rn), photosynthetically active photon flux density (PAR), air temperature, relative humidity (RH), soil heat flux (G) and soil temperature. Rn and PAR were measured at a height of 1.3 m using a net radiometer (model 7.1 net radiometer, Radiation and Energy Balance Systems, REBS, Seattle, Washington) and photosynthetically active photon flux density (model 190A quantumn sensor, LI-Cor, Inc., Lincoln, Nebraska), respectively. We used four soil heat flux plates (model HFT-3.1, REBS, Seattle, Washington) buried 2 cm below the moss surface to measure G. Air temperature and RH were determined using air temperature and relative humidity probe humidity (model HMP45C-L, Vaisala Inc., Helsinki, Finland) and soil temperature were measured at 0, 5, and 10 cm below the moss surface with cross-calibrated type-T thermocouples. Meteorological observations were made every 30 s and were averaged and stored over 30 min intervals using a data logger (model CR 21X, Campbell Scientific Inc., Utah).
Result
Weather condition during flux measurement
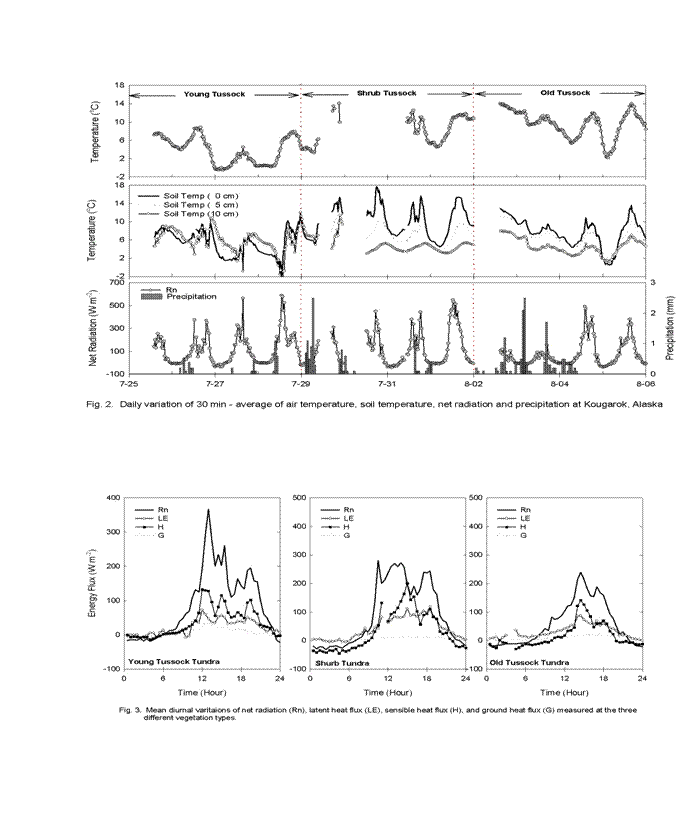
Portable tower measurements commenced from July 25 through August 5 for the three different vegetation types. General weather conditions during the measurement period are shown in Fig. 2. We had light snow and the air temperature was low during the early period (July 27-28), air temperature climbed up to 14 oC during the rest of measurements days with an overall average of 7.0°C. Average soil temperatures were 7.6 oC at 0 cm, 6.7 oC at 5 cm and 5.1 oC at 10 cm. Most days during the measurement period were cloudy but on each day, there was either a morning or afternoon period when maximum solar radiation was observed for 2-4 hours. Soil moisture contents were 0.19 % for the young tussock site and 0.12 % for the old tussock site from July 1 to July 24 (Larry Hinzman, in personal communication). Small precipitation events dominated the measurement period with an average of x mm falling each day (Fig. 2). Based on soil temperatures, thaw depth at the burn site, shrub, and tussock tundra site were around 1.3 m, 0.75 m and 0.5 m respectively (Hinzman, personal communication).
Energy closure and partitioning of energy fluxes
The closure of surface energy budget is one measure of assessing the overall performance of eddy covariance system. Table 2 indicates the experiment of the portable eddy tower was able to close energy budget within the range typically accepted for eddy covariance measurements ranging from 70 to 80% closure. Imbalances in the energy budget arise from several sources of errors: 1) different spatial sampling field between net radiometer and sonic anemometer and 2) storage of ground heat flux between the surface and soil heat flux plate.
Table 2. Statistics on closure of the surface energy balance for a young tussock tundra, shrub tundra, and old tussock tundra. The sum of net radiation and soil heat flux (Rn – G) is regressed on the sum of latent heat flux and sensible heat flux (LE + H).
|
Vegetation Type |
Slope |
Intercept |
r2 |
N |
|
Young Tussock |
0.7 |
2.62 |
0.85 |
116 |
|
Shrub Tussock |
0.8 |
6.67 |
0.93 |
87 |
|
Old Tussock |
0.8 |
2.25 |
0.95 |
115 |
Net radiation is partitioned into various energy streams such as latent heat flux (LE), sensible heat flux (H) and ground heat flux (G). The mean diurnal variation of Rn, LE, H and G is shown in Fig. 3 for each vegetation type. The general trace of the mean diurnal pattern of Rn revealed the cloudy sky condition during the measurement period. H and LE followed the trace of Rn with H higher than LE from 10:00 through 20:00 at the young tussock tundra. H and LE accounted for 41% and 24% of Rn at the young tussock tundra and this resulted in a high Bowen ratioof 1.7, more than twice as high compared to other two sites (Table 3). At the shrub tundra and old tussock tundra, H was higher than LE during the daytime and LE was higher than H in the early morning and nighttime. Sensible heat made up 30 ~ 34 % of Net radiation, while the fraction of net radiation removed from the surface in LE varied from 45 to 54% at the shrub and the old tundra sites. The partitioning of G to Rn varied from 7 to 15%. Grown heat flux was < 50 W m-2 at all three sites.
Table 3. Partitioning of the surface energy balance in three vegetation types.
|
Vegetation Type |
H |
LE |
G |
Bowen Ratio |
|
Young Tussock Tundra |
41 |
24 |
8 |
1.7 |
|
Shrub Tundra |
34 |
45 |
7 |
0.7 |
|
Old Tussock Tundra |
30 |
54 |
15 |
0.6 |
CO2 and H2O fluxes
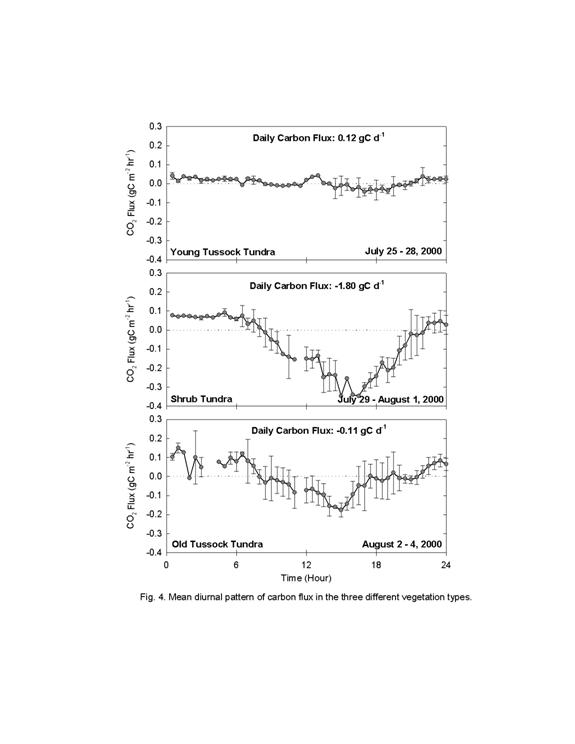
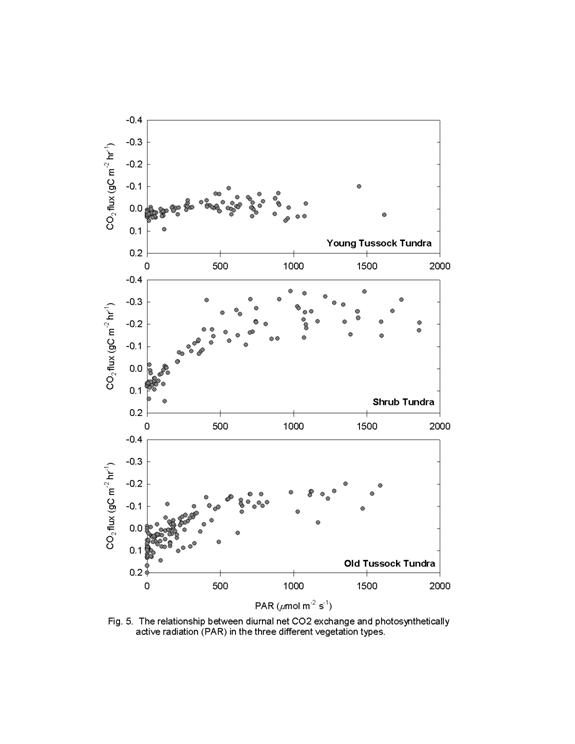
Fig. 4 compares the mean diurnal patterns of CO2 and H2O fluxes in the young tussock tundra, the shrub tundra, and the old tussock tundra. Young tussock tundra showed very weak sink activity ( » -0.04 g C m-2 hr-1) of carbon flux during the day time and weak source activity in the morning and night time resulting in a small net source of carbon for the day of 0.12 g C m-2 d-1. Approximately 60 % of the surface at the site was bare soil after a fire in 1996 at the young tussock tundra. Soil respiration through the bare soil exceeded photosynthesis by plant is assumed to result it being a carbon source to the atmosphere at the young tussock tundra. In contrast to the young tussock tundra, the shrub tundra and the old tussock tundra was a net sink of carbon to the atmosphere. Net CO2 uptake occurred from 8:00 to 22:00 h, with peak uptake between 14:00 and 16:00 at both sites. The shrub area had the largest net sink of -1.80 g C m-2 d-1 and the old tussock tundra was a small net sink of approximately -0.11 g C m-2 d-1. The diurnal variation in net CO2 exchange was driven by diurnal variation in PAR with minimal variation in both soil and air temperature that would have had a more important control on soil and plant respiration. The average diurnal response of net CO2 exchange to variation in PAR over the different vegetation types is well represented in Fig. 5. Each point represents a 30-min average of net CO2 flux and PAR during the measurement period. The shrub tundra showed the strongest uptake capacity in response to light and the young tussock tundra showed the weakest uptake capacity in response to light.
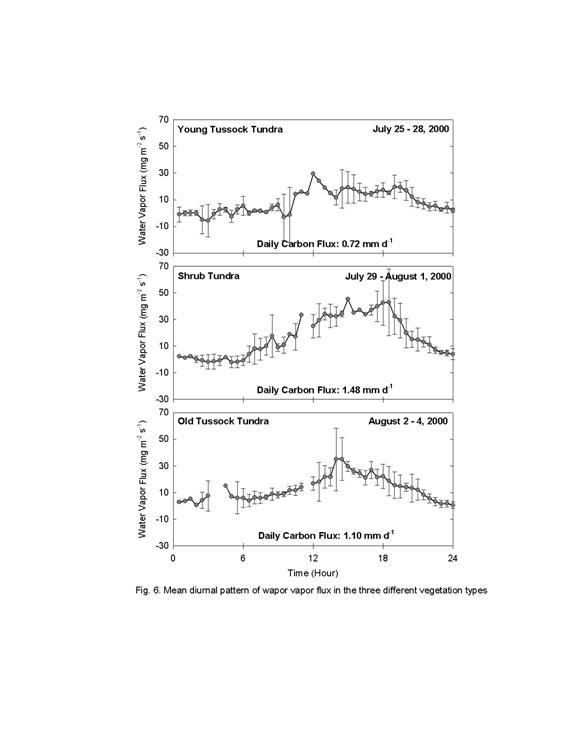
Water vapor flux in the three different vegetation types generally showed similar mean diurnal pattern with a gradual increase of water vapor flux in the morning, reaching a maximum value in the afternoon and declining water vapor flux in the evening (Fig. 6) and no evidence of a midday closure of stomates due to either temperature or water stress. Daily water vapor flux was 0.72 mm d-1 at the young tussock tundra, 1.10 mm d-1 at the old tussock tundra with the shrub tundra exhibiting the highest water vapor flux of 1.48 mm d-1.
Conclusion
Eddy covariance observations using a portable tower revealed large differences in carbon, water vapor exchange and energy exchange. Ground heat flux consumed 7-15% of net radiation and was similar among the different vegetation. In part, this is due to a common substrate and low leaf area index. It is likely that differences would have been observed over a annual measurement period and in part, is one of the concerns in making short, local measurements and extrapolating over a 60-90 day growth season. Latent heat flux varied from 24 through 54% among the different vegetation, while 34% of net radiation was partitioned into sensible heat flux. The young tussock tundra showed the highest Bowen ratio, 1.7 while the shrub tundra and the old tussock tundra showed a Bowen ratio of 0.6 to 0.7, respectively. The strongest net uptake of carbon was at the shrub tundra (–1.80 g C m-2 d-1). A Net source of CO2 exchange, 0.12 g C m-2 d-1 occurred at the young tussock tundra due to respiration exceeding CO2 uptake over the course a day.
This study suggests that variation in energy and mass exchanges within a range can be detected using a portable eddy tower over different tundra vegetation types. A single land-surface parameterization for the arctic tundra is currently being used in regional and global climate models. Therefore an assessment of spatial variation within a region would increase the accuracy of predicting Arctic climate according to global warming.
Equipment List of Portable Eddy Tower
|
Instrument |
Quan. |
S/N |
Note |
|
Gill Sonic (R3) |
1 |
000065 (M/N: 1210R3) |
|
|
SIU |
1 |
000055 (M/N: 1210SIU) |
|
|
PCI |
1 |
000008 (M/N:1199PC) |
|
|
LI-COR 7500 |
1 |
75H-0013 |
|
|
LI-COR Control Box |
1 |
75B-0013 |
|
|
Q-7 |
1 |
Q00105 |
CF*: (+) 8.83 / (-) 10.83 |
|
Quantum |
1 |
27900 |
|
|
Soil heat flux plate |
4 |
- H003026 - H003027 - H003028 - H003029 |
CF:36.2 CF:34.4 CF:34.7 CF:34.1 |
|
HMP 45C-L |
1 |
VO810044 |
|
|
21X |
1 |
10663 |
|
|
Computer monitor |
1 |
0392042457 (M/N: Radius S-1) |
|
|
Enclosure |
1 |
White Campbell Sci. Enclosure |
|
|
Storage module |
|
|
|
|
* CF: Calibration Coefficient |
|||
 |