|
netCDF VARIABLE NAME |
DESCRIPTION |
UNITS |
|
nc{'Jdd'} |
Julian day (1997) |
decimal day |
|
nc{'latitude'} |
latitude SHEBA site |
[degree] |
|
nc{'longitude'} |
longitude SHEBA site |
[degree] |
|
nc{'pressure'} |
surface pressure |
[hPa] |
|
nc{'ws2_5'} |
wind velocity at 2.5 m |
[m/s] |
|
nc{'ws10'} |
wind velocity at 10 m |
[m/s] |
|
nc{'wd2_5'} |
wind direction at 2.5 m |
[degree north] |
|
nc{'wd10'} |
wind direction at 10 m |
[degree north] |
|
nc{'T2_5'} |
temperature at 2.5 m |
[Celsius] |
|
nc{'T10'} |
temperature at 10 m |
[Celsius] |
|
nc{'q2_5'} |
specific humidity at 2.5 m |
[g/kg] |
|
nc{'q10'} |
specific humidtiy at 10 m |
[g/kg] |
|
nc{'rhi2_5'} |
relative humidity with respect to ice at 2.5 m |
[%] |
|
nc{'rhi10'} |
relative humidity with respect to ice at 10 m |
[%] |
|
nc{'T_sfc'} |
surface temperature (best estimate) (1) |
[Celsius] |
|
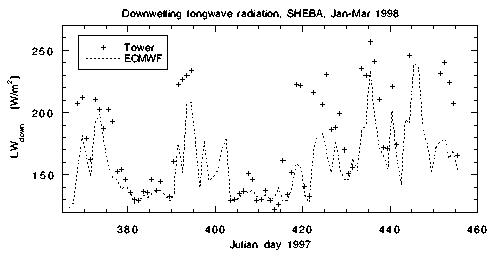
nc{'LWd'} |
longwave downwards |
[W/m^2] |
|
nc{'LWu'} |
longwave upwards |
[W/m^2] |
|
nc{'SWd'} |
shortwave downwards |
[W/m^2] |
|
nc{'SWu'} |
shortwave upwards |
[W/m^2] |
|
nc{'SWucor'} |
shortwave upwards, albedo Perovich (2) |
[W/m^2] |
|
nc{'tower_albedo'} |
albedo from tower shortwave measurements |
- |
|
nc{'line_albedo'} |
albedo from Perovich data (2) |
- |
|
nc{'RR_org'} |
precipitation (optical raingauge) (3) |
[mm/hour] |
|
nc{'RR_ncr'} |
precipitation (weighing gauge) (3) |
[mm/hour] |
|
nc{'prep_SPO_corr'} |
precipitation, SPO corrected (3) |
[mm/hour] |
|
nc{'ustar'} |
friction velocity (eddy correlation) |
[m/s] |
|
nc{'hs'} |
sensible heat flux (eddy correlation) |
[W/m^2] |
|
nc{'hl'} |
latent heat flux (eddy correlation) |
[W/m^2] |
|
nc{'usb_2_5'} |
ustar from tower at 2.5 m |
[m/s] |
|
nc{'usb_10'} |
ustar from tower at 10 m |
[m/s] |
|
nc{'hsb_2_5'} |
sensible heat flux from tower at 2.5 m |
[W/m^2] |
|
nc{'hsb_10'} |
sensible heat flux from tower at 10 m |
[W/m^2] |
|
nc{'hlb_2_5'} |
latent heat flux from tower at 2.5 m |
[W/m^2] |
|
nc{'hlb_10'} |
latent heat flux from tower at 10 m |
[W/m^2] |
|
nc{'wvp'} |
MWR water vapor path |
[cm] |
|
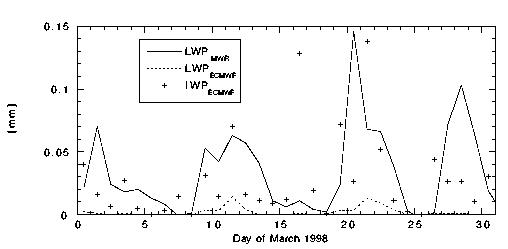
nc{'lwp'} |
MWR liquid water path (4) |
[mm] |
(1)Three surface temperature measurements were measured from a General Eastern, an Eppley radiometer and a Barnes radiometer. The Eppley is the most reliable, though there are periods when the other two are also reasonable, and one period (May) when the Eppley data may be slightly off. Tsfc is the best estimate of the surface temperature, and is principally based on slight corrections to the Eppley temperatures and the Barnes temperatures when the Eppley was known to be wrong.
(2) SWucor has been computed from the observed downwelling shortwave radiation multiplied by the line-averaged albedo measured by Don Perovich for the period between 1 June 1998 and 27 September 1998. The line albedo for this period is substantially lower than the tower albedo and more representative for the area-averaged albedo.
(3) The SHEBA Project Office (SPO) maintained a Nipher shielded snow gauge system about 300 m from the SHEBA ship, which was visited daily around 20 UTC. Corrections were made for wind, losses due to (temperature-dependent) evaporation and gauge wetting, and precipitation amount in intervals in which the reported weather is blowing (rather than falling) snow are set to zero. We regard the corrected SPO precipitation time series as the most trustworthy currently available for SHEBA.
(4)There is still some controversy about the accuracy of the microwave radiometer (MWR) liquid water path (LWP) retrievals, since the most reliable in-situ FIRE-ACE aircraft measurements of LWP over SHEBA (taken in May-July 1998) average only half as large as the simultaneous MWR LWP (Judith Curry, personal communication).
REQUIRED ACKNOWLEDGEMENTS FOR USE OF THE TOWER DATASET:
"We thank our colleagues in the SHEBA Atmospheric Surface Flux Group, Ed Andreas, Chris Fairall, Peter Guest, and Ola Persson for help collecting and processing the data. The National Science Foundation supported this research with grants to the U.S. Army Cold Regions Research and Engineering Laboratory, NOAA's Environmental Technology Laboratory, and the Naval Postgraduate School."
Persson, P. O. G., C. W. Fairall, E. L. Andreas, and P. S. Guest, 2000: Measurements of the meteorological conditions and surface energy budget near the atmospheric surface flux group tower at SHEBA, J. Geophys. Res., submitted.
PRINCIPAL INVESTIGATORS OF TOWER DATA
Here follows the text of the original readme file.
RELEASE NOTES FOR ARM MICROWAVE RADIOMETER DATA FROM SHEBA
AUTHOR: James Liljegren
PERIOD: 5 December 1997 - 9 September 1998
The MWR data during SHEBA that appear in the netCDF files from ARM named "shbmwrtip" include the zenith brightness temperatures (TB) derived from elevation angle scans ("tip curves"). These are valid only when the sky is clear. A noise diode provides a calibrated reference when the sky is cloudy. The clear sky results are used to calibrate the noise diode. This is the calibration that I have performed. Subsequently I re-applied the statistical retrievals to to these data to derive the correct precipitable water vapor (PWV) and liquid water path (LWP).
I developed the statistical retrievals using radiosondes launched from Barrow, Alaska during 1990-1995 stratified by month. Because the retrievals represent monthly-averaged statistics, significant departures from these mean conditions can lead to biases in the retrieved quantities. The most noticeable example is non-zero LWP during clear sky conditions. When the surface presure and temperature are such that the air density is significantly greater than the monthly mean implicit in the retrieval, a positive LWP bias is observed; as a low-pressure condition approaches the bias may become negative. This is a problem with the retrieval; it does not indicate a problem with the radiometer calibration. Improved retrievals which account for this and other problems will be applied to these data in the near future.
KNOWN PROBLEMS
In examining the data so far I have determined that there are several problems:
1. Prior to 5 December 1997 the radiometer was operated in zenith-viewing line-of-sight (LOS) mode. The only calibration scans prior to 5 December 1997 were acquired for a period of 4 days in mid-October. Unfortunately, the radiometer configuration appears to have been incorrect during this calibration period. (I don't know how this happened; it was correct when I sent it to Barrow in March 1997.) I may be able to recover these data, but they are they are not included in this release.
2. Subsequent to 5 December 1997 the radiometer was operated in a continuous scanning (calibration) mode at my recommendation. I also provided the correct configuration file and a new executable file to replace those lost in a disk crash on 20 November 1997.
3. The additional insulation I provided with the radiometer for very cold periods was not installed. Consequently the thermal stabilization was affected at low temperatures (below about -25 C) which occurred frequently during December, January and February plus early March. Fortunately these cold temperatures occurred only when the skies were clear of liquid water clouds and so the tip curve data provide valid measurements during these periods. Unfortunately, because the radiometer software recognized this thermal stabilization failure, data are only available for approximately 15 minutes per hour during these periods of extreme cold.
4. The radiometer is equipped with a continuously-operating external blower that prevents snow and other debris from accumulating on its window. A 750 Watt heater mounted in the blower housing is controlled by a moisture sensor and is designed to prevent moisture from accumulating on the microwave window. Unfortunately the heater, which is on a separate power circuit so as not to burden a UPS, was plugged into the wrong outlet and was not powered. I did not discover this until late June when I was investigating why moisture kept accumulating on the window. Consequently there are periods when the data are invalid due to water on the microwave window. Periods when this problem appear likely have been flagged.